

Original Post: LibUX
I’m a higher education library employee at West Virginia University (WVU) Libraries. I work as a user experience architect / designer on a small development team comprised of a full-stack developer, a software developer, a graduate assistant (GA) junior developer, a GA designer, and a web librarian.
I assume that our workflow is probably similar to that of other higher education libraries. The majority of our development team’s projects come simultaneously from internal systems work, special collections, a web team (that encompasses librarians from multiple libraries and departments), various committees, and individual personnel requests.
It is common for our development team to constantly shoulder a myriad of different projects and tasks that range from web applications, usability testing, digital collections, third-party applications, custom development, custom design, custom website development, special projects, and much more as needed.
One of the problem that our development team seems to frequently encounter is that the loudest voices (or squeaky wheels) in the library often get workflow priority, and thus get their work completed first. Most of the time it isn’t clear to our development team what is truly important to stakeholders, personnel, or WVU Libraries’ patrons. We also seem to be stuck in a waterfall workflow — a workflow model that originated in the manufacturing and construction industries — wherein deadlines are decided without our input, and there seems to be no order of what projects we should work on, and what projects should slide.
To even further compound the problem, it also seems that a lot our librarians are largely unaware of each others’ projects, what progress others are making, or even our priorities to system maintenance and priorities. We are only a full-time staff of four, with two more part-time staff, and we have a major problem not being able to move away from the backlog table.
Our whole team knows that we have to move from a waterfall workflow to a more agile workflow (see this Base36 article about advantages and disadvantages of both workflows). We know that we desperately need a way to get multiple stakeholders’ input, while being aware of each others’ projects. We know that we should be focusing on what is valuable to patrons and library personnel, but in regards to what’s viable and feasible.
In short, we need a miracle!
The “Value / Feasibility” Exercise
Last year I was fortunate enough to attend UX Intensive, a four-day workshop series for user experience professionals and design managers that examines design strategy, design research, service design, and interaction design. It was a great workshop and I highly recommend it for facilitating strategies for jumping right in, tackling, and fixing problems with design management and design thinking techniques.
Suffice to say, I came back to the library empowered, and in the middle of last November, the WVU Libraries development team facilitated their first request and workflow experiment using design management/thinking strategy.
How it works
These are the steps we employed:
- Get similar stakeholders together
- Have them make a list of major tasks and projects for the next six months that require the involvement of the development team
- Count the number of tasks
- Multiply the number of tasks by three — that is their number of total points.
Stakeholders were then asked to discuss the tasks with our team, and each other, and assign points to each task; however, the stakeholders were limited by the total number of points that they could spend, every task had to have at least one point, and they should assign or spend points in regards to the task/projects:
- Importance/Value to both the users/patrons and the library/personnel, where the most valuable are higher numbers.
- Viability/Feasibility wherein the least effort, cost, or maintenance were higher numbers.
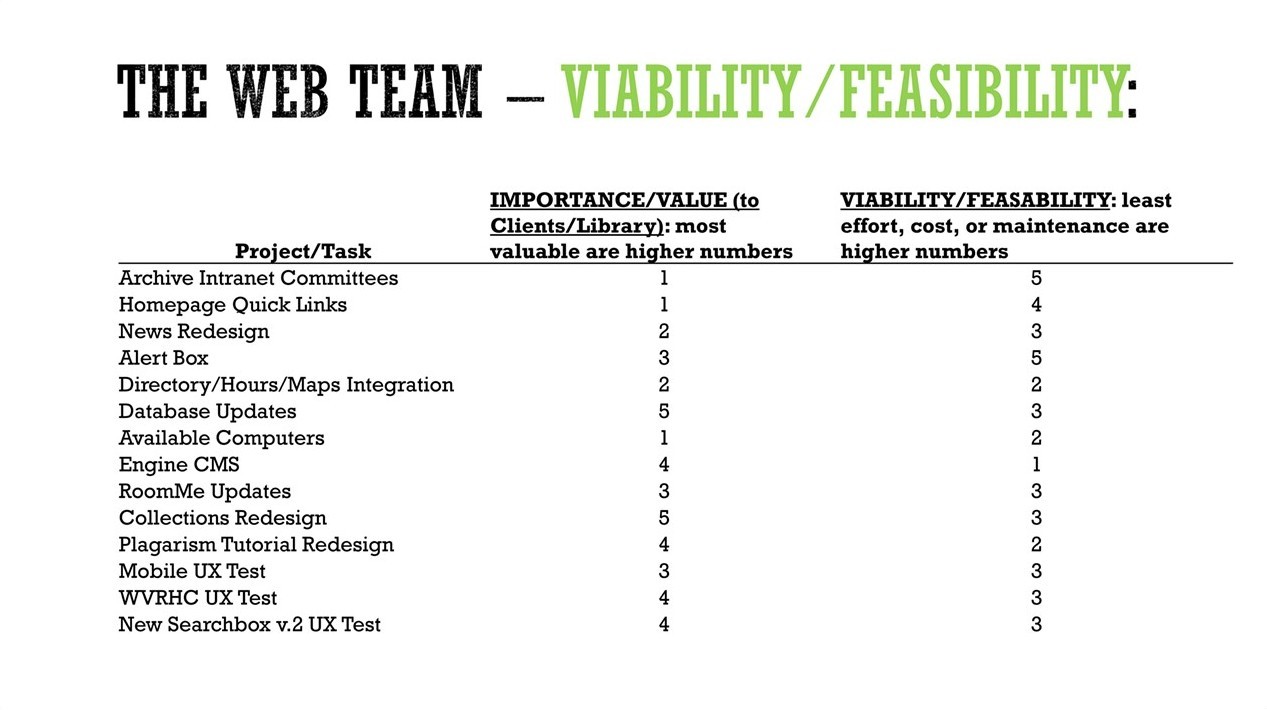
The web team made a list of 14 tasks, which when multiplied by three equaled a total of 42 points. They then spent 42 points in the Importance/Value column, another 42 points in the Viability/Feasibility column, and made sure to leave at least 1 point in each project or task.
In the example above we can see that the web team ranked updating the “Databases” web application and redesigning the “Collections” web application as having the most importance/value to our patrons and the library. Simultaneously, they ranked archiving the intranet committees and developing an alert box as taking the least amount of time and effort. During this entire process it was very important for our team to be present to consult on projects, discuss deadlines, help facilitate task/project understanding, and resolve any technology questions that needed answered.
Visualizing the Results
With these results we could dynamically and immediately visualize projects and tasks in chart-form for everyone, ensure that different teams and stakeholders have the same opportunity to set priorities based on value and feasibility, and create understanding of:
- where to start working based on what takes the least amount of time and what is most important to stakeholders, personnel, and users
- what is least important and takes the largest amount of time to complete.
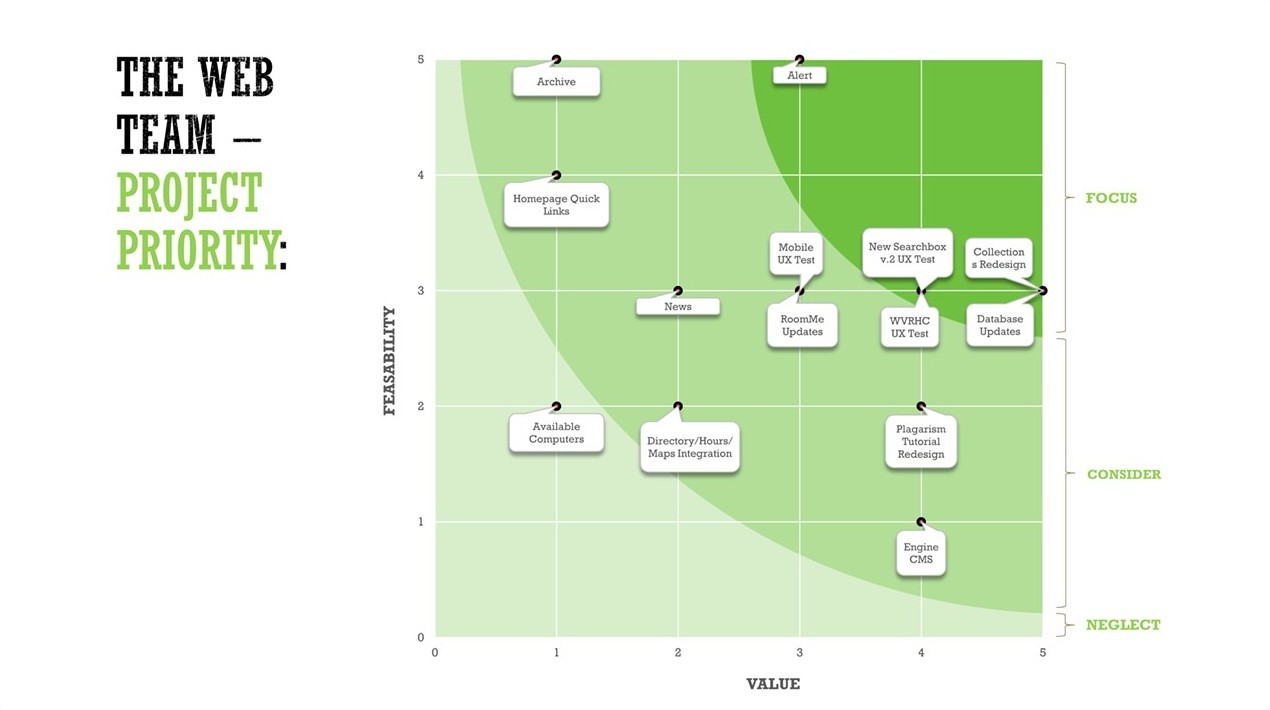
We dynamically plot the 14 tasks with a chart in Microsoft Excel so the web team can see that updating the databases web application, redesigning the collections web application, and developing an alert box are the most important tasks which take the least amount of time.
Our development team ended up calling for three separate meetings that incorporated all of the members of the web team, another meeting for special collections, and a final meeting with the staff from the systems office. We then created three visualizations in chart-form for each meeting group, and went one step further to combine all three of the meeting group’s data into one visualization. It was our team’s hope that the combined visualization could serve as a workflow priority for the development team, especially if both administration and each of the meeting groups approved of the process and results.
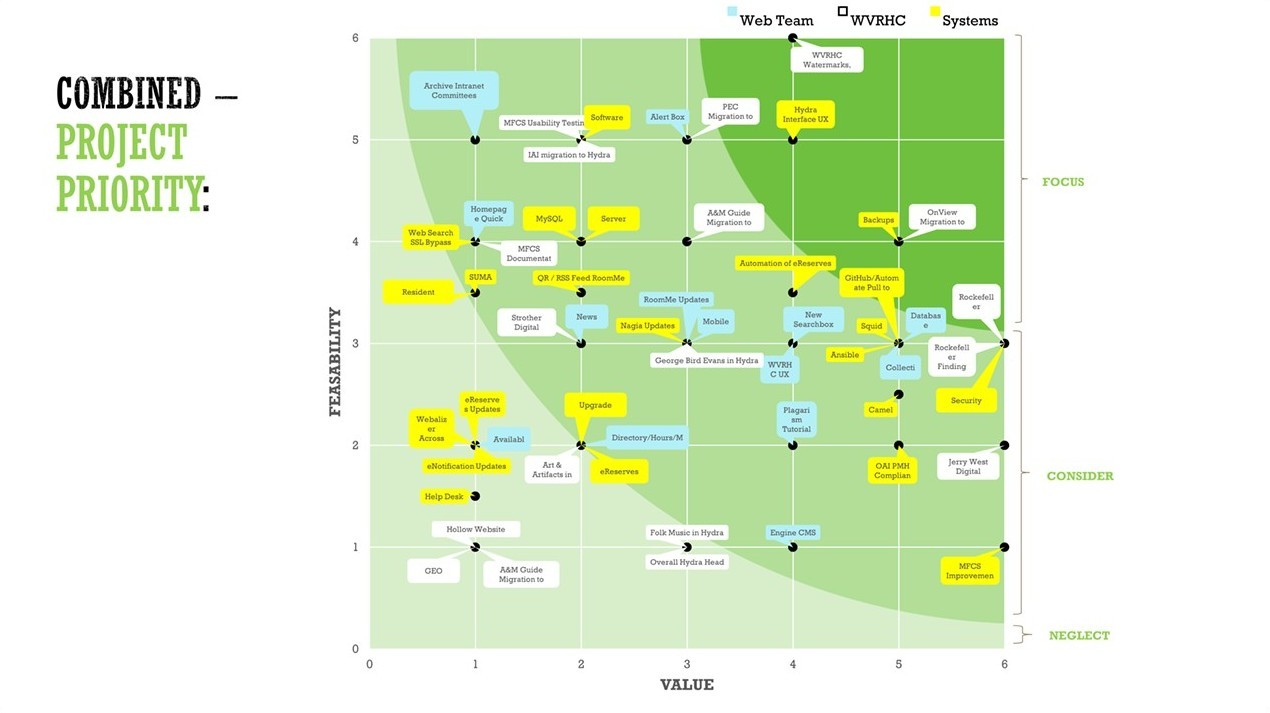
By combining multiple team’s charts in Microsoft Excel we see an overall workflow priority for our development team, which is established from stakeholders input; this provides a place on which to focus, and a roadmap to work towards.
Reception and Going Forward
The response was immediate! The individual teams greatly appreciate the process and thanked the development team for answering their questions, facilitating the session, and helping them to see each other’s projects and priorities. Not only did the individual teams approve of the strategy sessions, but administration is also happy with the initiative our team showed, and wants to work with us to refine and improve the process.
Going forward our development team is scheduled to facilitate this process on a seasonal basis (every-three-months) to gauge major project/task importance, involvement, management, and priority. I can now say that the deafening sound of the squeaky wheels has subsided, there is a light at the end of the tunnel, and our development team’s morale has greatly improved.