Takeaways from UX Intensive
Day-log presentations from both Patrick Quattlebaum and Ayla Newhouse comprised the first two days of UX Intensive, each day focusing on Design Strategy and Design Research.
Design Strategy
The first day was concerned with Design Strategy, and Quattlebaum (or PQ) started the day by discussing the balancing act – between Making and Thinking – that is Design. PQ spoke to both Making and Design Thinking as integral parts of the Design process, but that one in excess of one another can be disastrous.
For example, if I designer is constantly Making all of the time, they will take a Design to clients or stakeholders and they will say, “make it blue.” The designer will then start over, change it, and take it back… where upon the clients/stakeholders will say, “add more red, and change the font.”
The Designer will repeat this over and over, exhausting all of their time and effort.
I used to know a Designer like this, and their relationship with their supervisor and employers was horrendous. Every day, and even multiple times a day, they would present their work. They never really sat down and found out exactly what was wanted, and so they were always designing in the dark, and constantly changing their work.
Likewise, a Designer that does too much Design Thinking will never actually finish a project. They will constantly be reworking the project over and over, and then when a new philosophy, framework, or initiative they hear about surfaces, they will rework the project.
I also used to work with a designer like this, and in one fiscal year, they only ever completed one to three projects; the rest of their time was spent following and reading popular designers on Twitter, trying new frameworks that they read about on Reddit, or constantly rewriting CSS based on conference presentations.
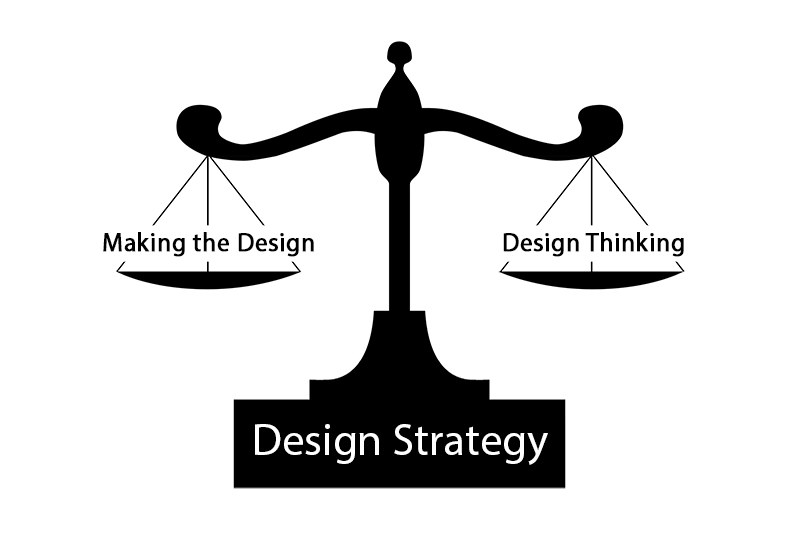 The solution here that PQ mentions is one that Design Management as an emerging degree has been championing, and involves developing a Design Strategy with your clients/stakeholders. So, think of weighing scales: on one side of the scale is Making, and on the other side is Design Thinking; if there is too much Design Thinking the Designer is drowning and never completing anything, and if there is too much Making the designer is constantly reworking, stressing-out, and no progress is made.
Indeed their has to be a balance between Making/Design Thinking, and that balancing agent is Design Strategy. The three worst outcomes that occur with no Design Strategy in place are:
- Design being seen as an execution function only
- Design being under-sourced
- Design Research not being considered
So, apart from balancing Making and Design Thinking with Design Strategy, it’s important knowing where you are currently in regards to internal and external stance, value, and activities, identifying your’e sitting table in the workflow process, and identifying what level of Design Strategy you’re are functioning.
Knowing…
Knowing your internal and external stance, value, and activities provides context for Design, constraints for Design, and connections for Design… all of which are necessary and important.
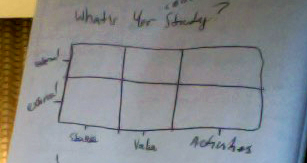 Example Chart
Identifying…
Also important is identifying at what level of Design Strategy you’re are functioning:
- Product Backlog
- Service Strategy
- Customer Experience Strategy
… and at what level of Design Strategy are you currently functioning, wherein Design is treated as a:
- Core Competency (highest, like Apple, Google, etc.)
- Strategic Contributor
- Business Function
- Activity Optimizer
- Part of the Process (lowest)
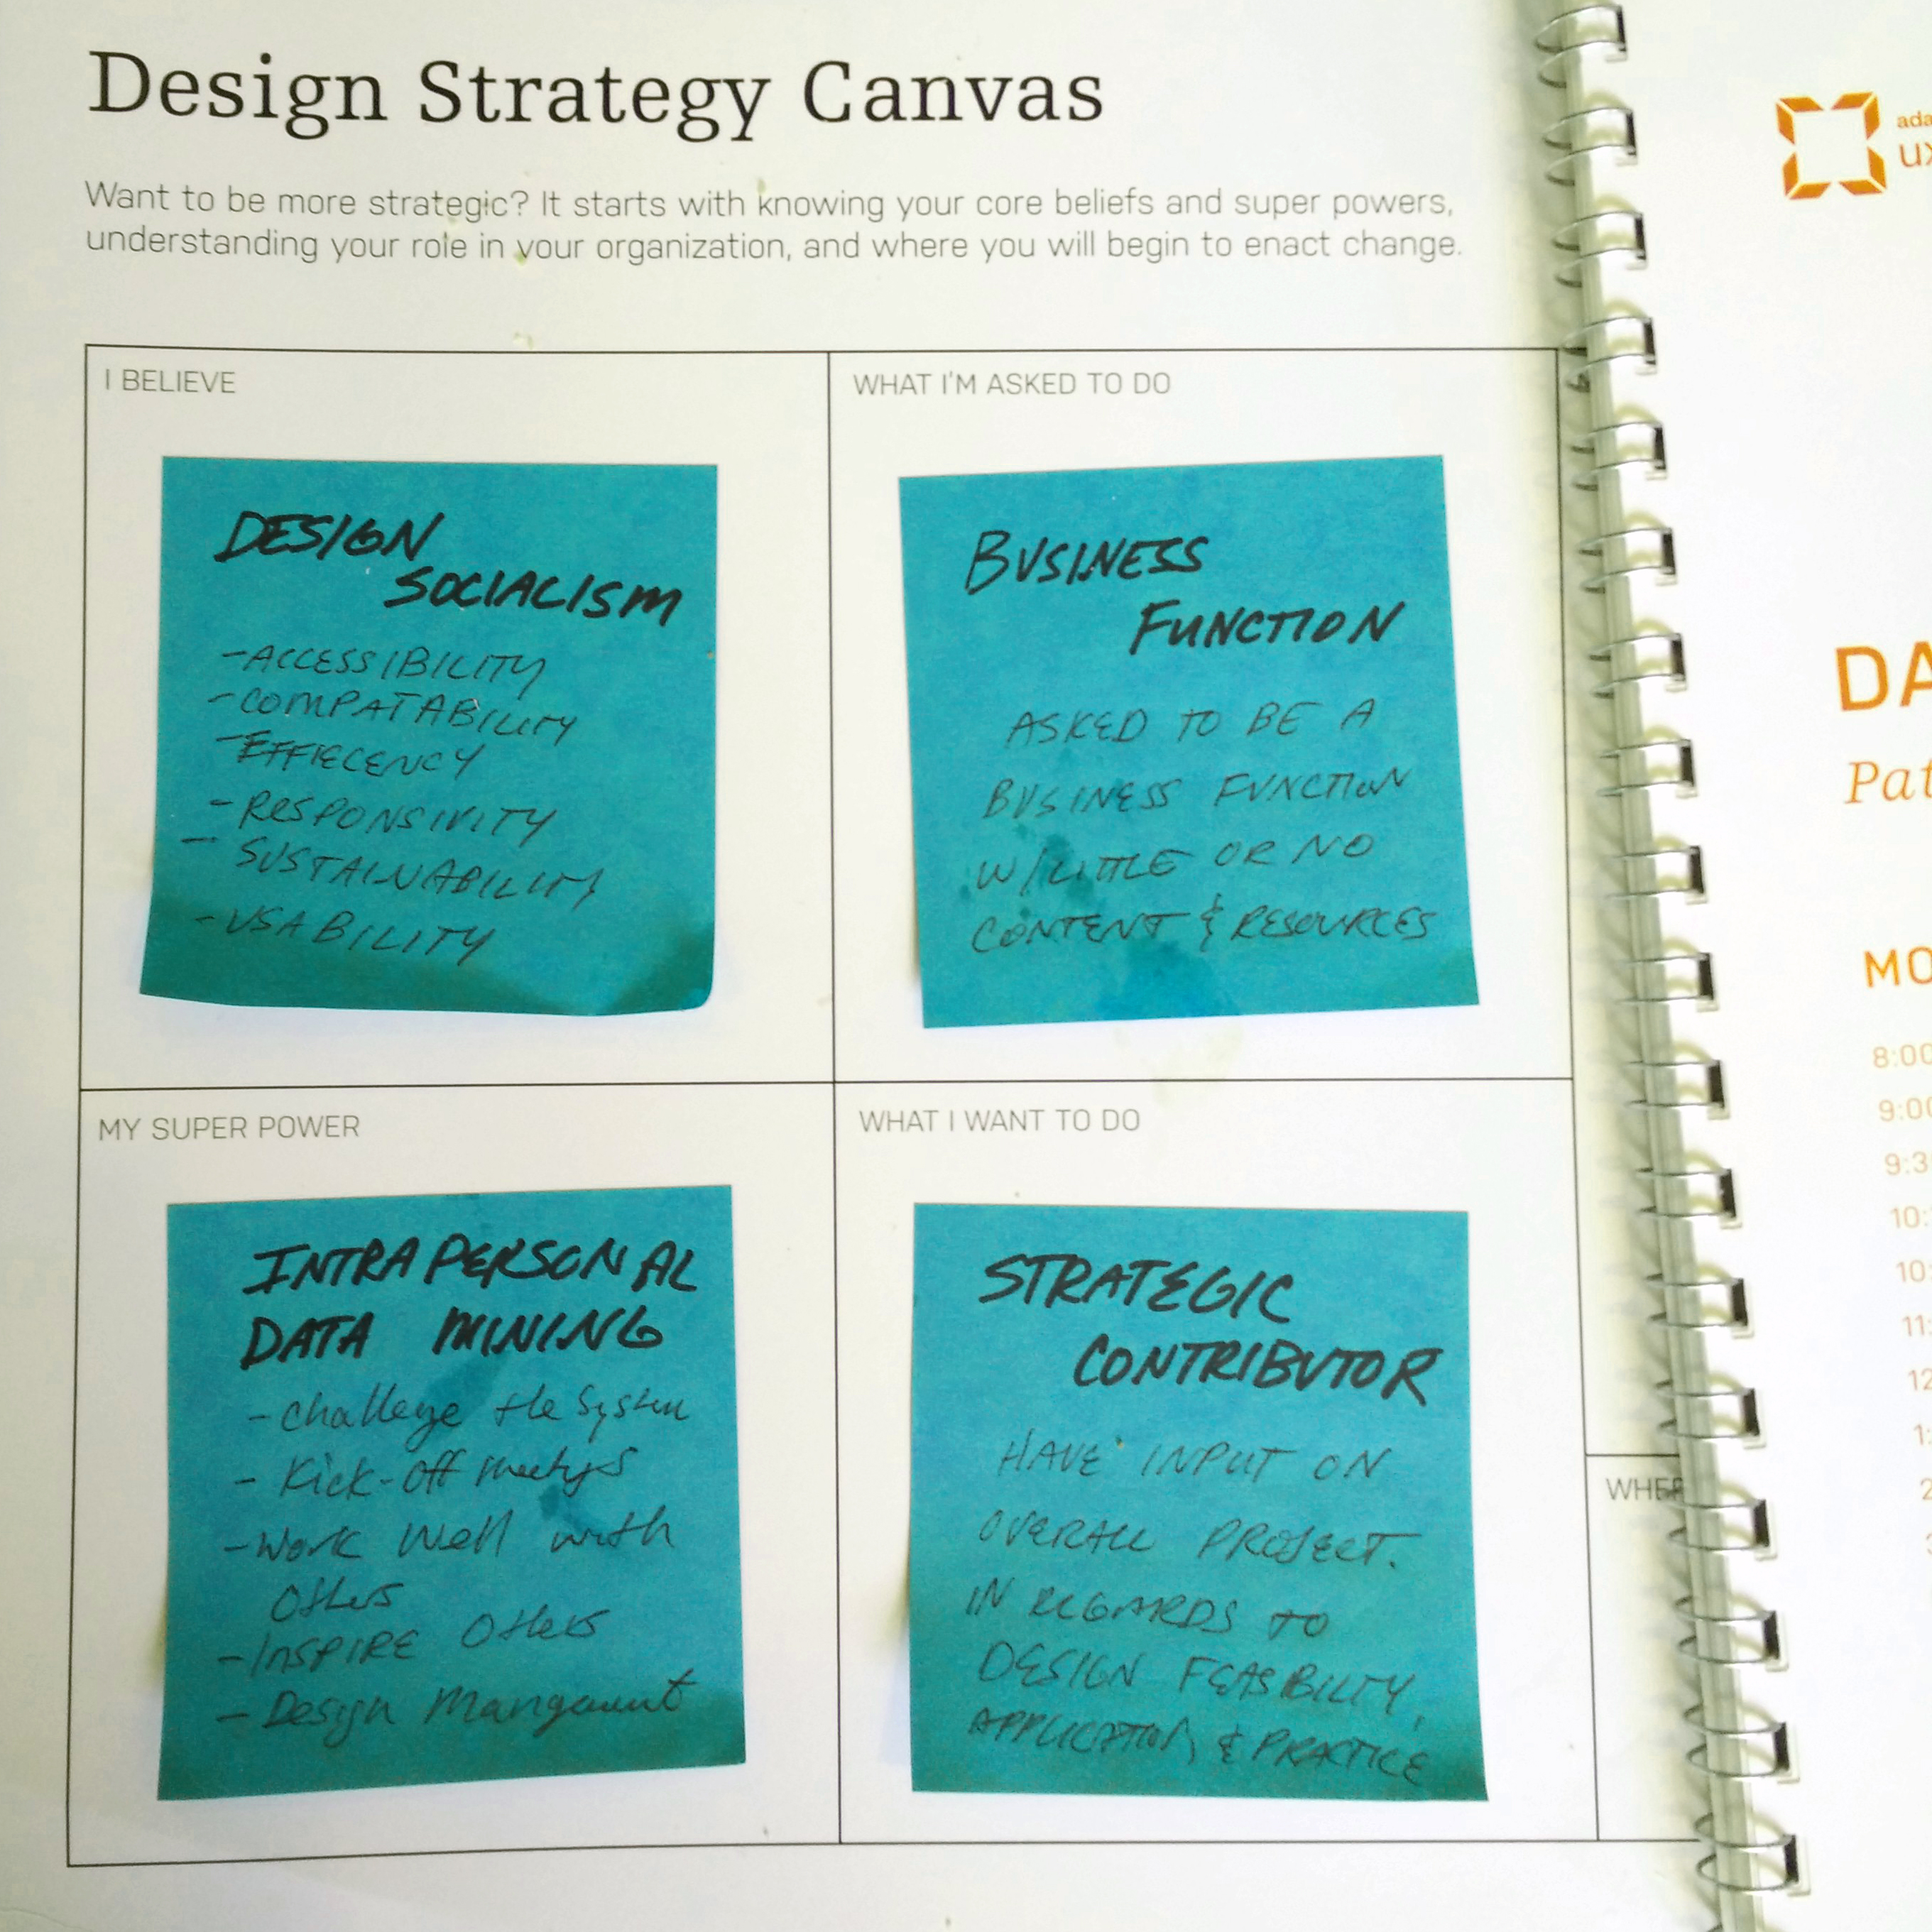 My current Design Strategy Canvas
Try back at work…
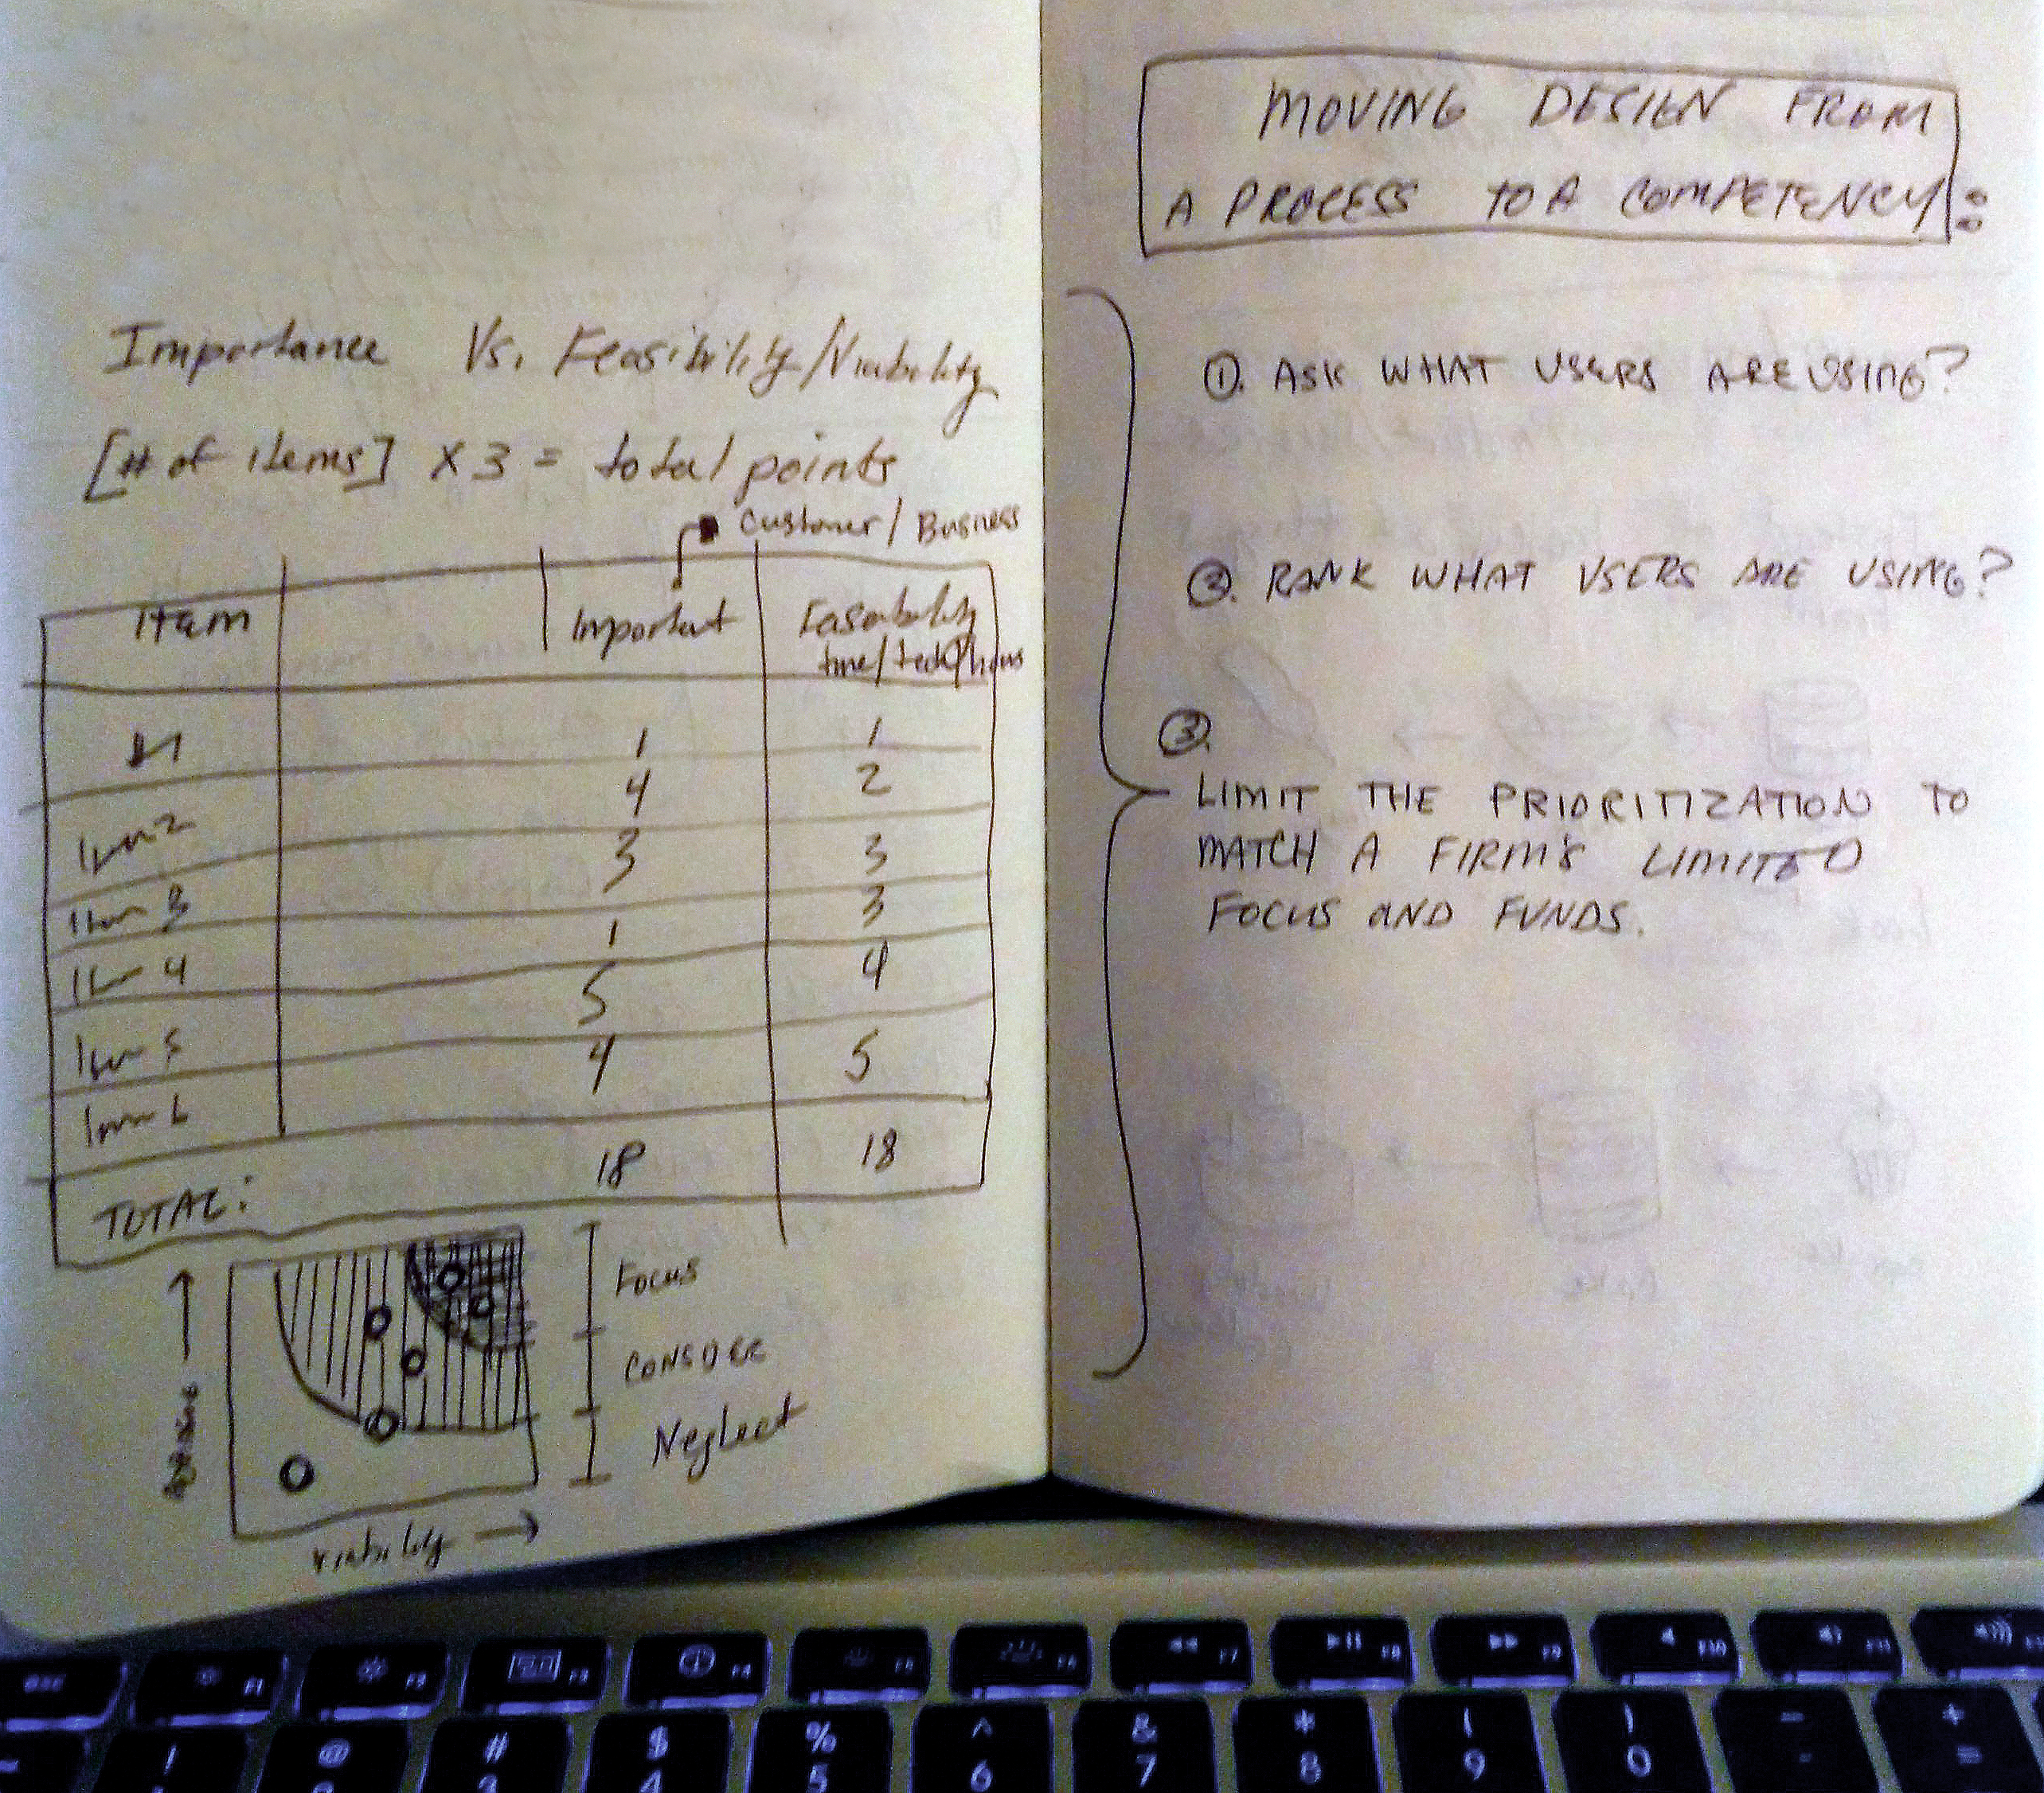
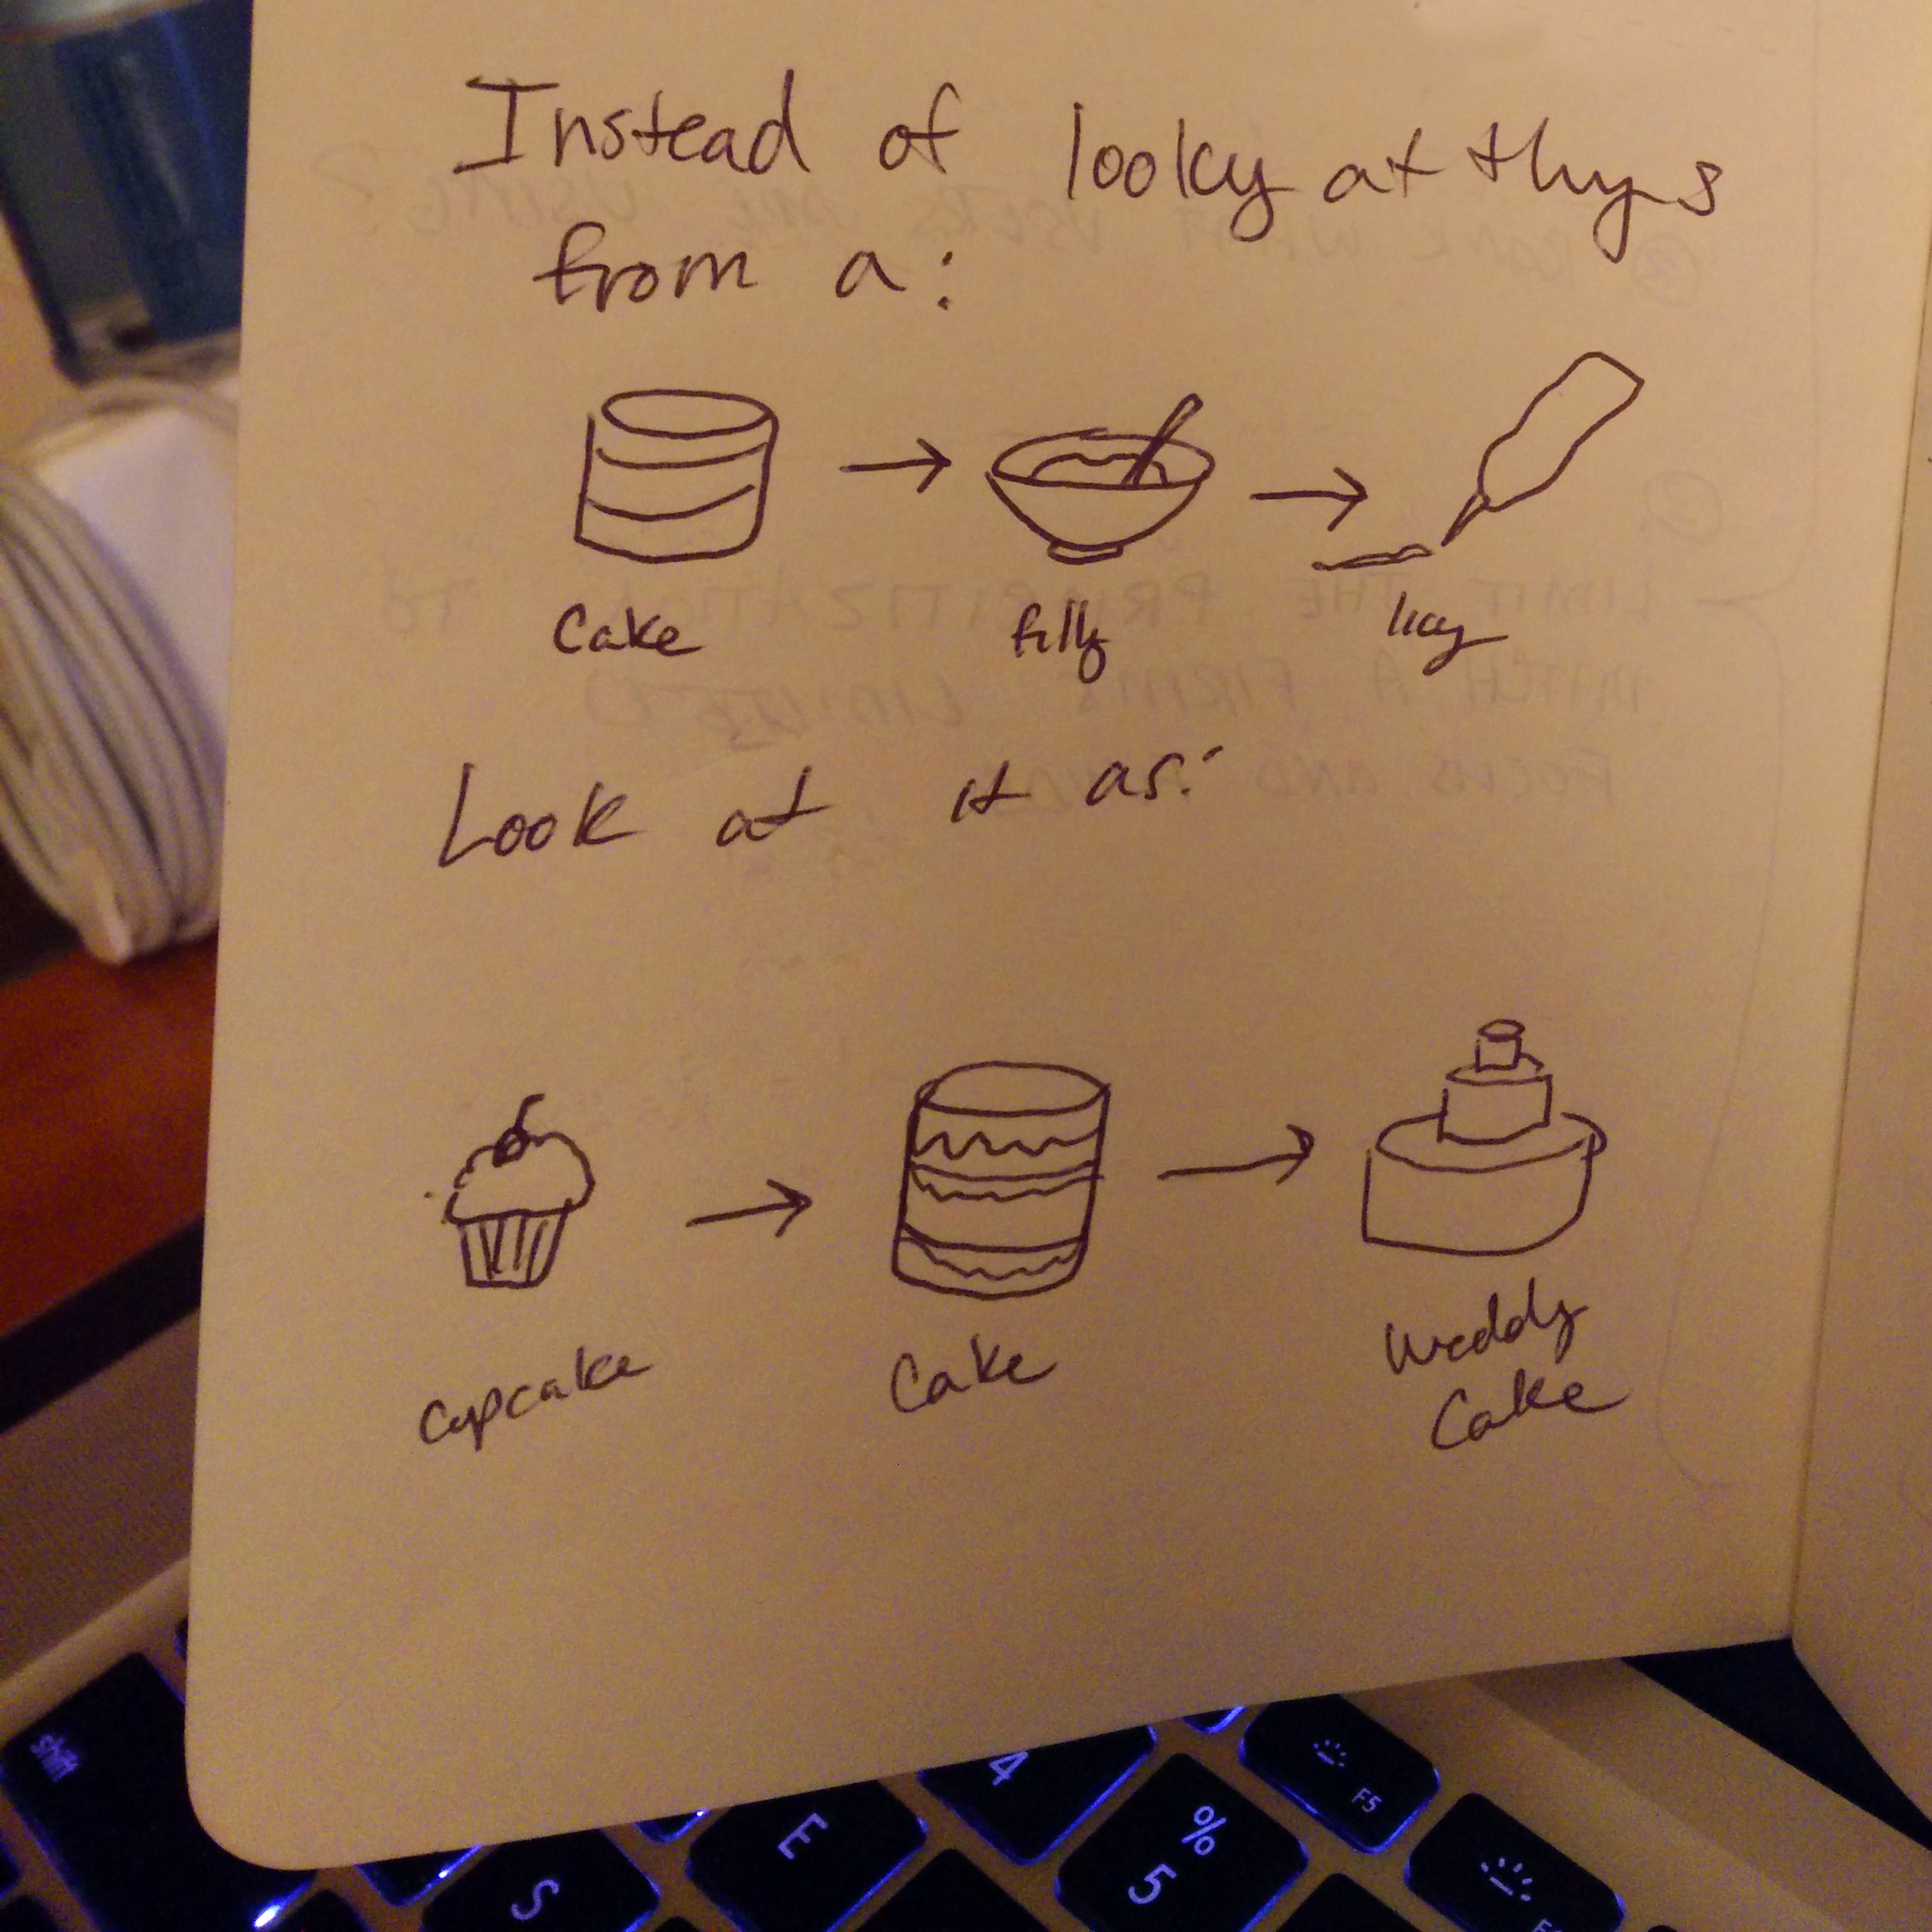
For me, two great takeaways from the Design Strategy/Day 1 are:
- Leveraging project importance by visualizing data about importance versus feasibility/viability.
- Approaching, developing, and viewing minimum viable products (MVPs)/minimum viable services (MVSs) in a different way.
Design Research
The second day was concerned with Design Research, and Newhouse started the day by discussing the three most common ways of old thinking concerning clients, and by defining the term Design Research.
https://twitter.com/tim_broadwater/status/651417164558110720
The three ways of thinking about the client that doesn’t work are:
- Thinking that people are sheep
(everyone is a dummy, and simple is better) - Thinking that people only want more features for less
(people are cheap) - Thinking that people are task and goal orientated
(all people have type A personalities)
Newhouse then defines Design Research as:
The work that uncovers and articulates the needs of individuals and/or groups in order to inform the design of products and services in a structured manner.
https://twitter.com/tim_broadwater/status/651424212372996096
Newhouse then proceeded to discuss the importance of Triangulation, wherein Design Research – as opposed to Marketing Research – combines and cross-examines different types of qualitative and quantitative research. An example of Triangulation would be examining Google Analytics, with client surveys, usability testing results, and target audience personas to determine the top three services customers want. A positive outcome of Triangulation, and Design Research as a whole are to:
- Set Direction
- Reduce Risk
- Improve Quality
Steps of Design Research…
- It all starts with a question
I wonder if students can find the databases they need? - Define Research Objectives
- Build Your Hypothesis
- Identify Participants
Existing Customers/Potential Customers/Etc. - Choose a Research Method
Remote Research, Usability Testing, AB Testing, Analytics - Collect Data
- Analyze Data
Prioritize, Eliminate the Non-relative, Forge Connections, Create Relationships
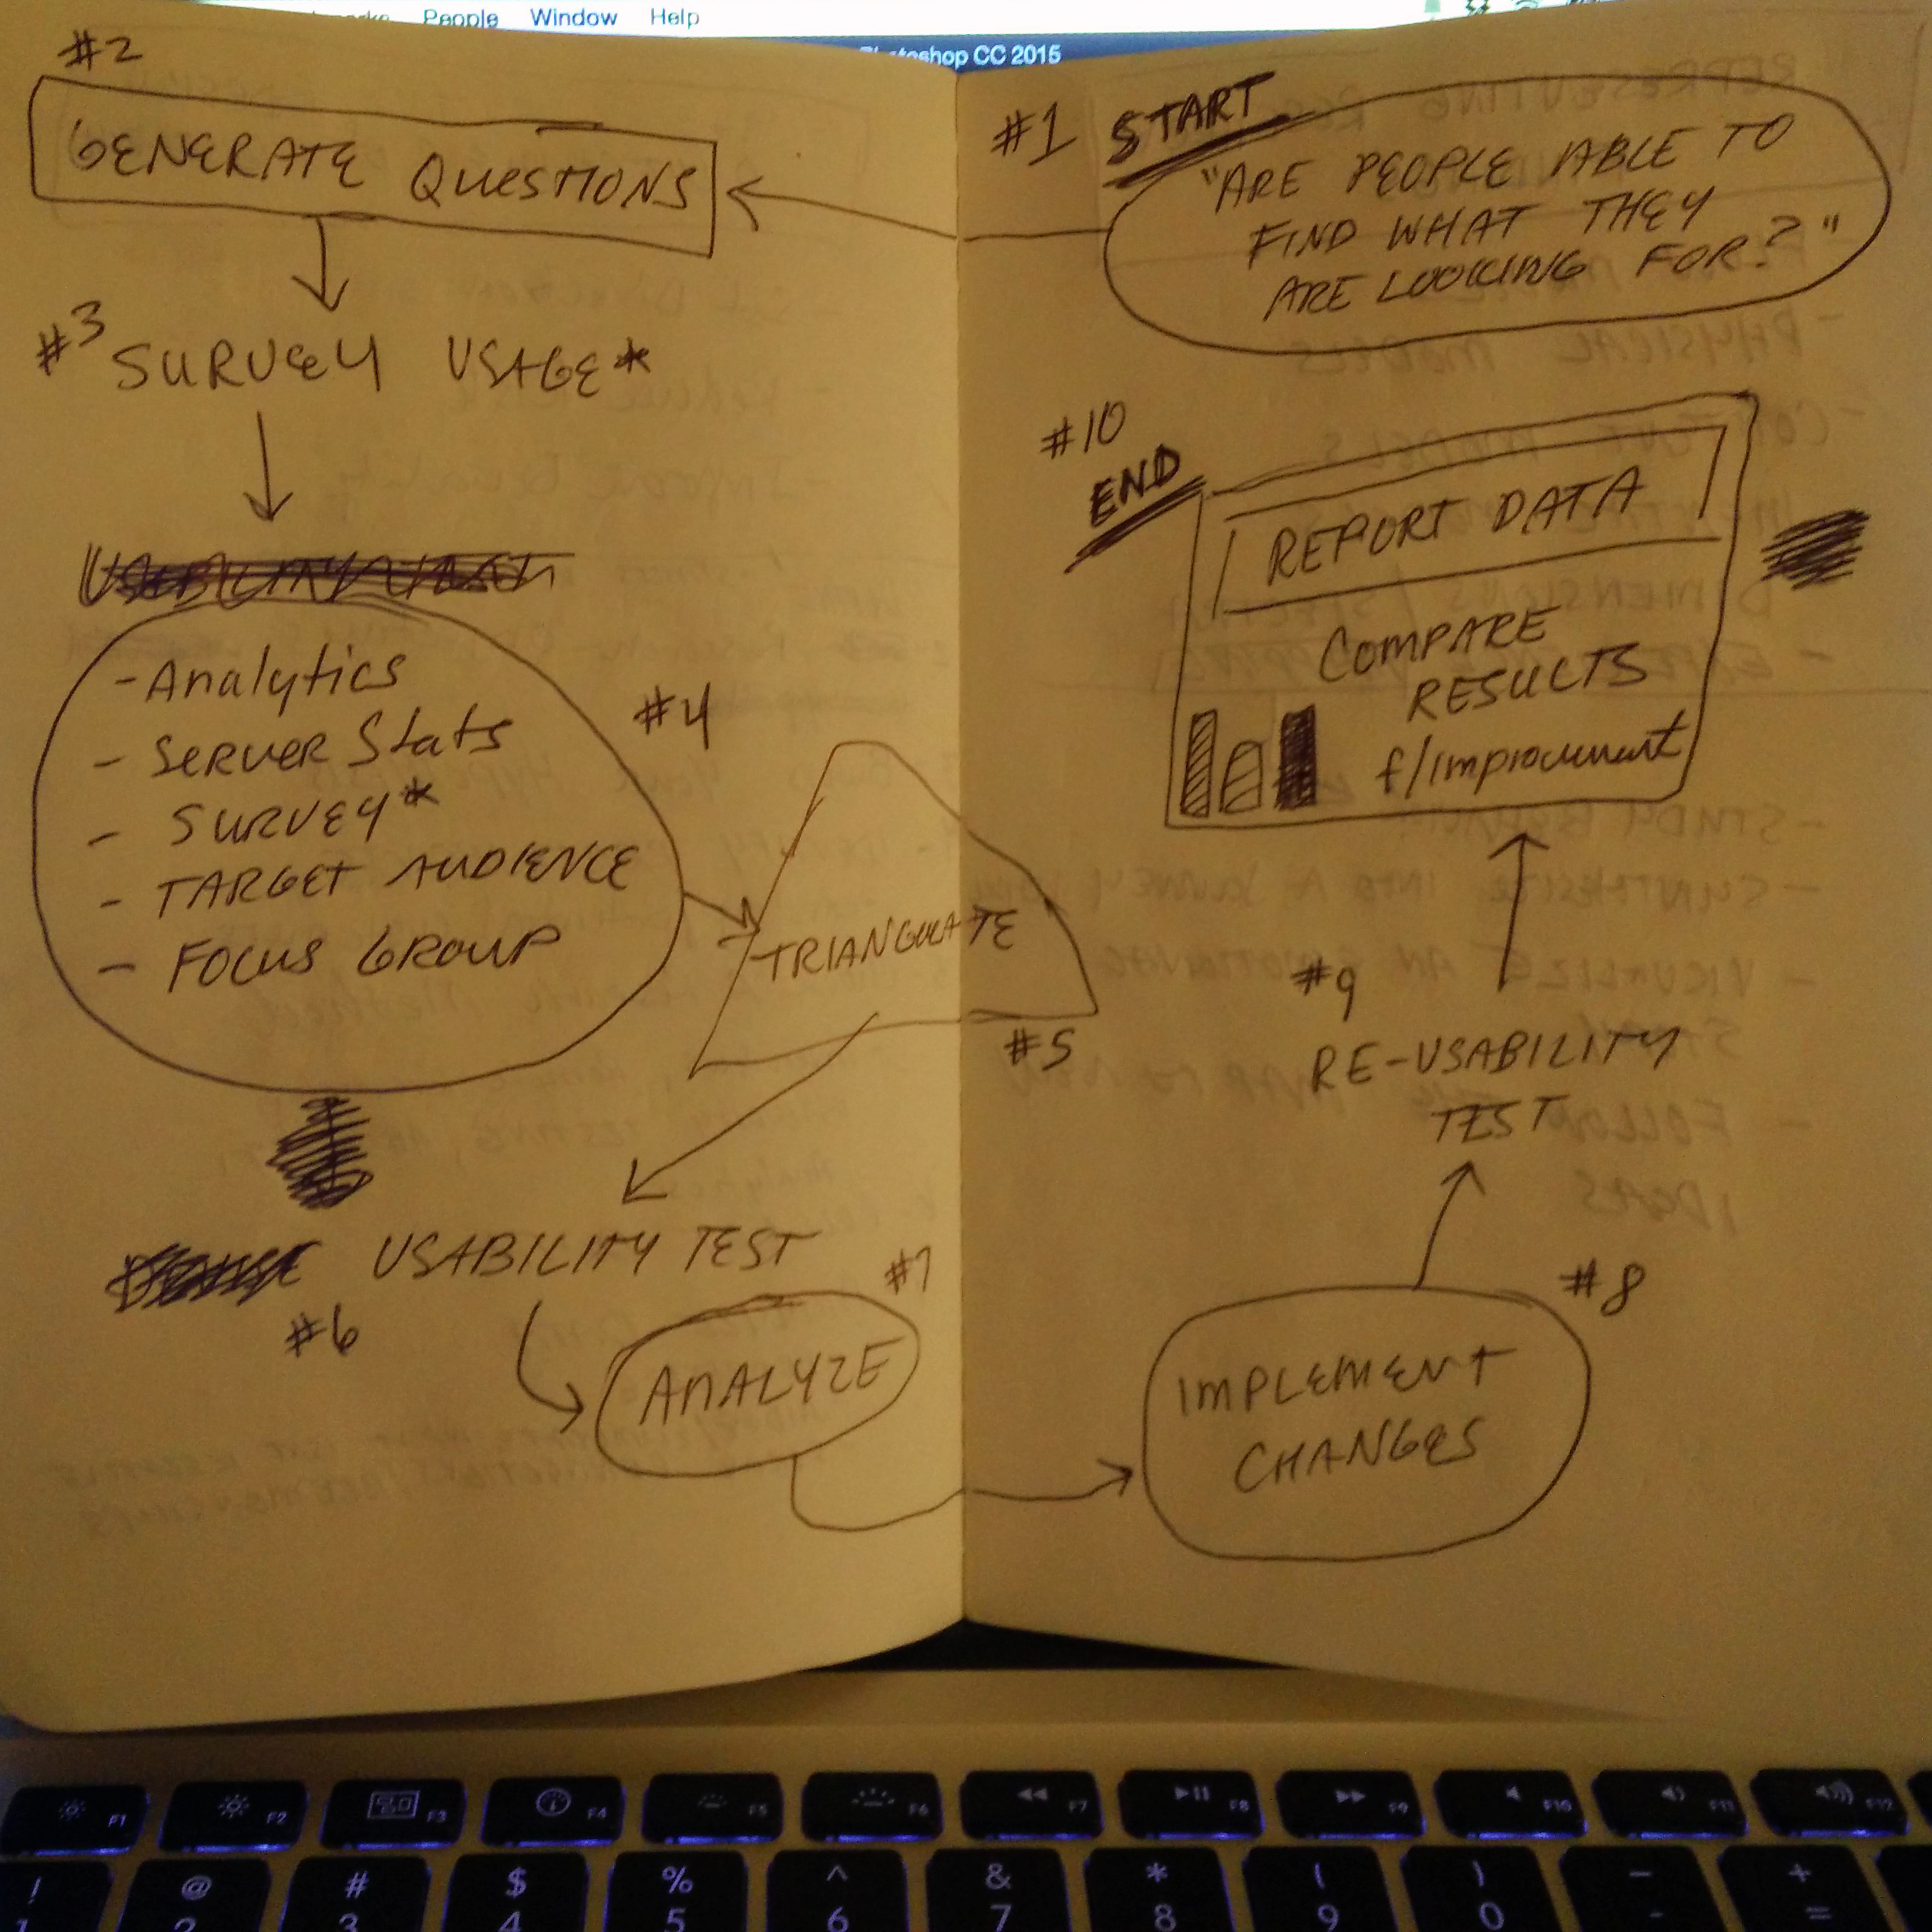 The Last Major Design Research I Conducted
Representing Data…
There are many ways to represent research findings, including:
- Flow Models
- Physical Models
- Content Models
- Mental Models
- Dimensions/Spectra
and through Experience Mapping like the following:
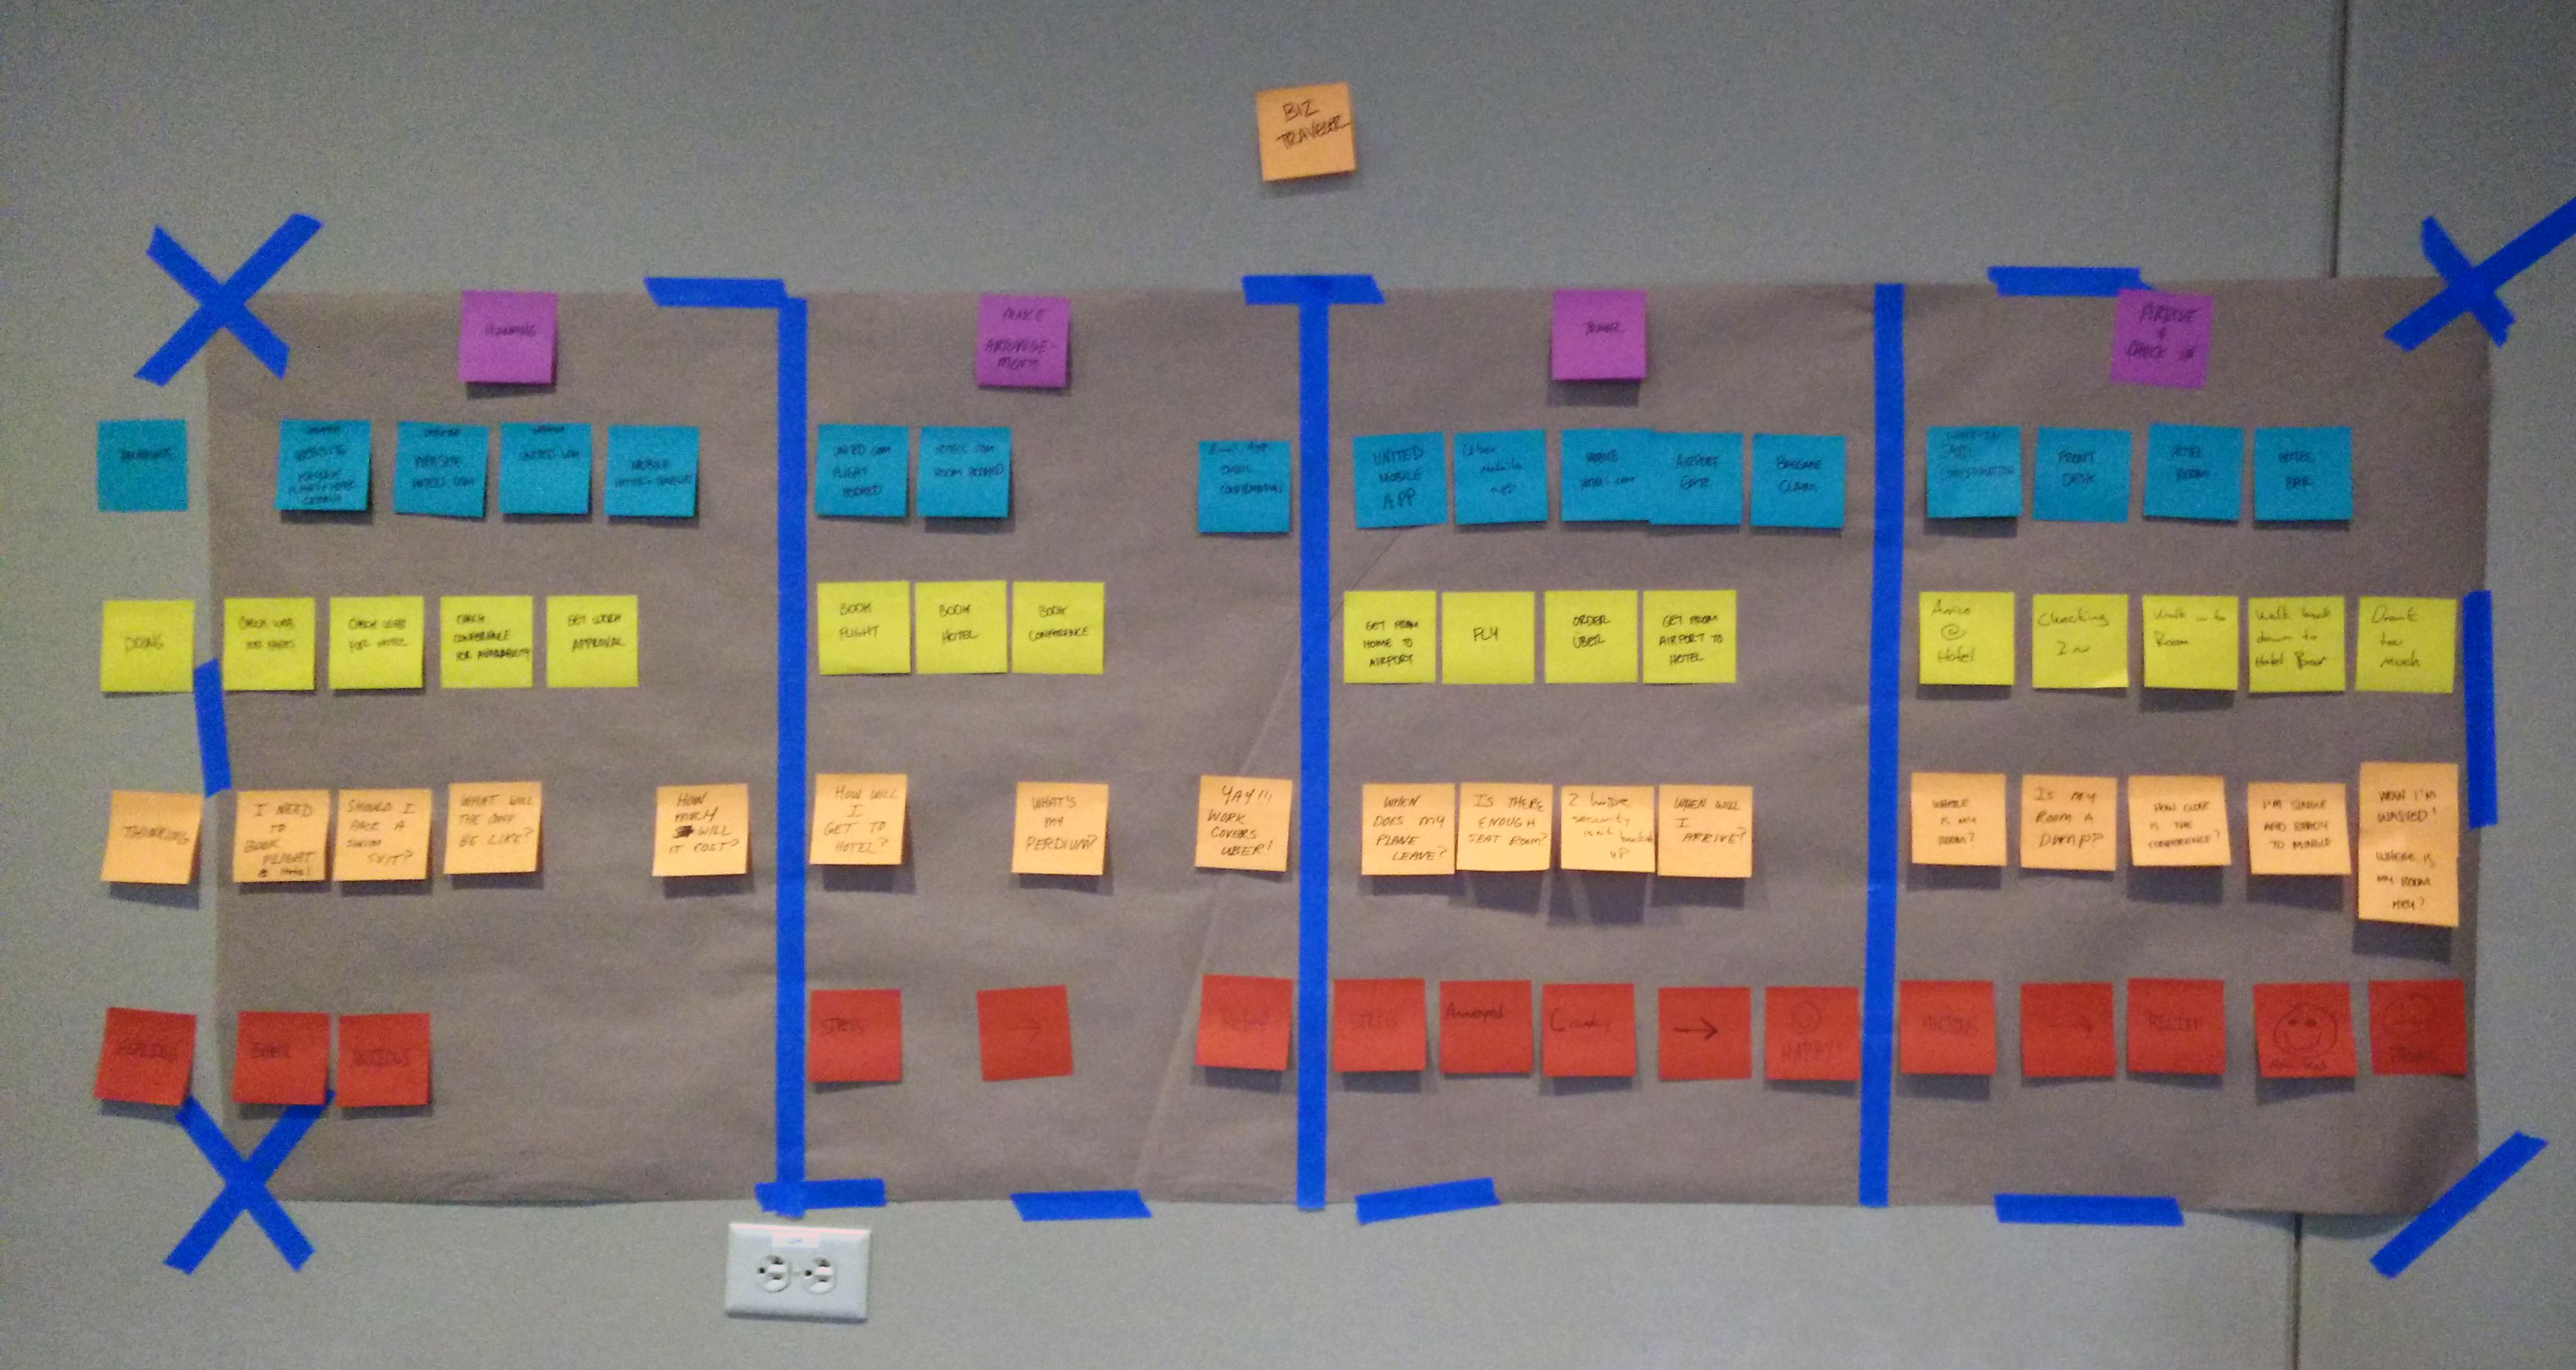 Experience Mapping of Hotel Pre-Stay
In closing, Newhouse discussed that Experience Mapping allows Designers to study behavior, synthesize data into a journey, and visualize an emotional storyline… all to follow the Experience Map to new ideas, conclusions, and research.
